
Bar Gauge Visualization
By Google
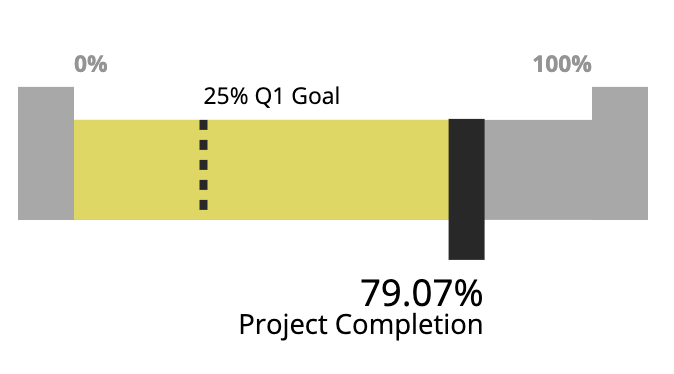
Use the Bar Gauge visualization to display a measure and progress to a goal with a highly customizable gauge.
Use the Bar Gauge visualization to display a measure and progress to a goal with a highly customizable gauge.
Category
Plug-insOverview
Install this plug-in for free by importing the project(s) from the GitHub repository linked at the top of the listing.
This is not an officially supported Google product.
The Gauge visualization displays a single value that measures progress toward a goal. It allows the viewer to assess the performance of a KPI at a quick glance. The gauge fills to its value with the ability to assign a target value or goal through a measure or a hard-coded value. This visualization is also an effective mechanism for displaying rate of change, similar to a speedometer, for ‘live’ data. The example below shows usage of this visualization, including switching between the horizontal and vertical variants.
This visualization accepts up to 1 dimension and up to 2 measures. A target value can be derived from the first or second measure, or hard-coded in the options panel.