
Force-Directed Graph
By Hashpath
Use a force-directed graph to show relationships between entities in your data.
Use a force-directed graph to show relationships between entities in your data.
Category
Plug-insOverview
Install this plug-in for free by importing the project(s) from the GitHub repository linked at the top of the listing.
This is not an officially supported Google product.
Originally created for Looker's Marketplace by Hashpath
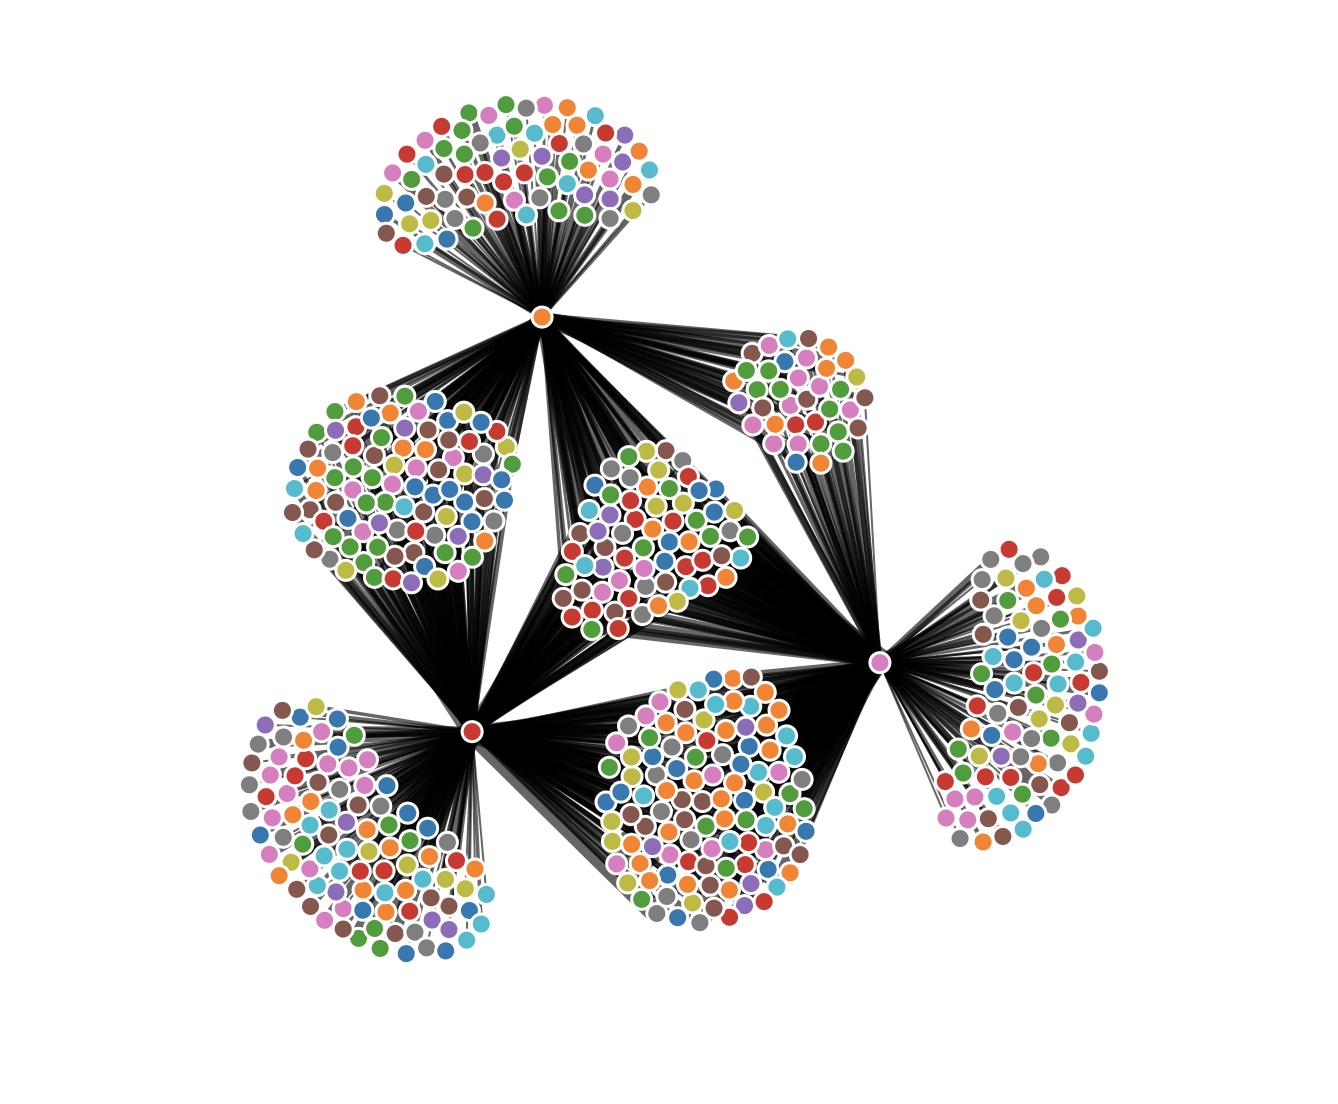
Nodes within the graph are mathematically clustered together based-on their relationship with other nodes. The weight of the link (line between nodes) is based on the magnitude of the relationship.
Force-directed graphs are particularly effective for visualizing how various entities (dimensions) are connected to each other.
This diagram requires 4 dimensions and 0-1 measures. It was built using the D3 visualization library.
Checkout the visualization's repo for more details.