
Gauge Visualization
Category
Plug-insOverview
This is not an officially supported Google product.
Deprecation Notice: This visualization will not be supported in the future and will be removed from the Marketplace in an upcoming release. We recommend that you install the Radial Gauge visualization instead.
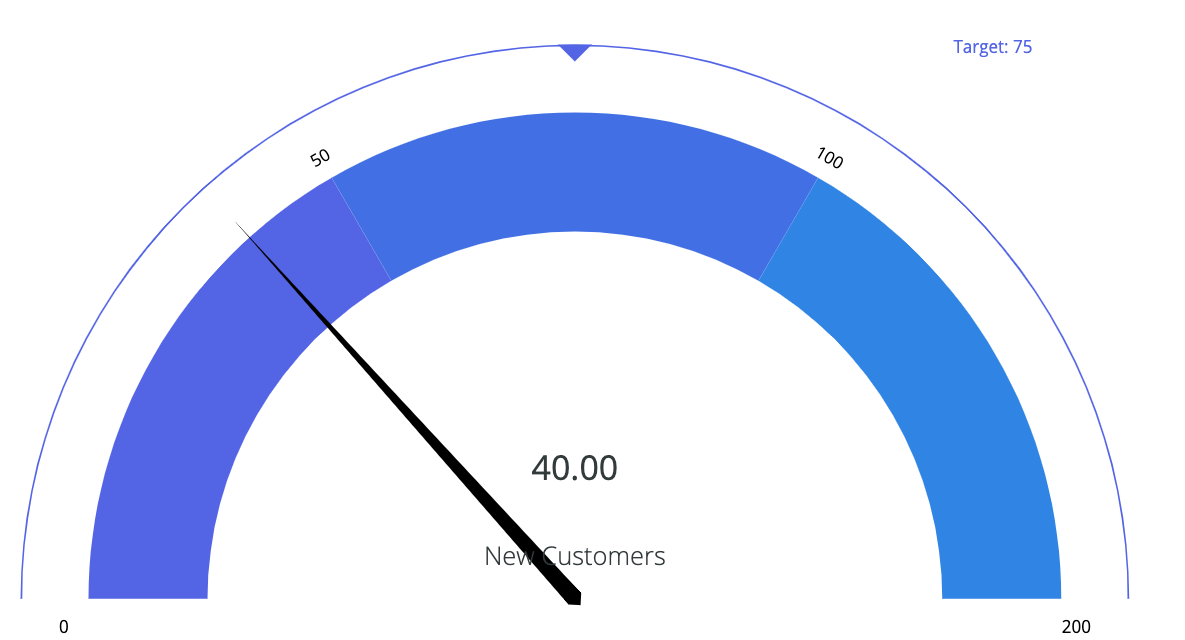
The Gauge visualization displays a single value that measures progress toward a goal. It allows the viewer to assess the performance of a KPI at a quick glance. The circular arc can be divided into multiple sections, with the ability to assign a target value or goal. This visualization is also an effective mechanism for displaying rate of change, similar to a speedometer, for ‘live’ data.
The visualization in the example below shows a gauge chart displaying the count of new customers for an illustrative business. At a glance, a viewer can determine the metric’s progress to the target value.
This visualization accepts one dimension and one measure, with the ability to hardcode a target value.