
Gauge Multiple Visualization
Category
Plug-insOverview
This is not an officially supported Google product.
Deprecation Notice: This visualization will not be supported in the future and will be removed from the Marketplace in an upcoming release. We recommend that you install the Radial Gauge visualization instead.
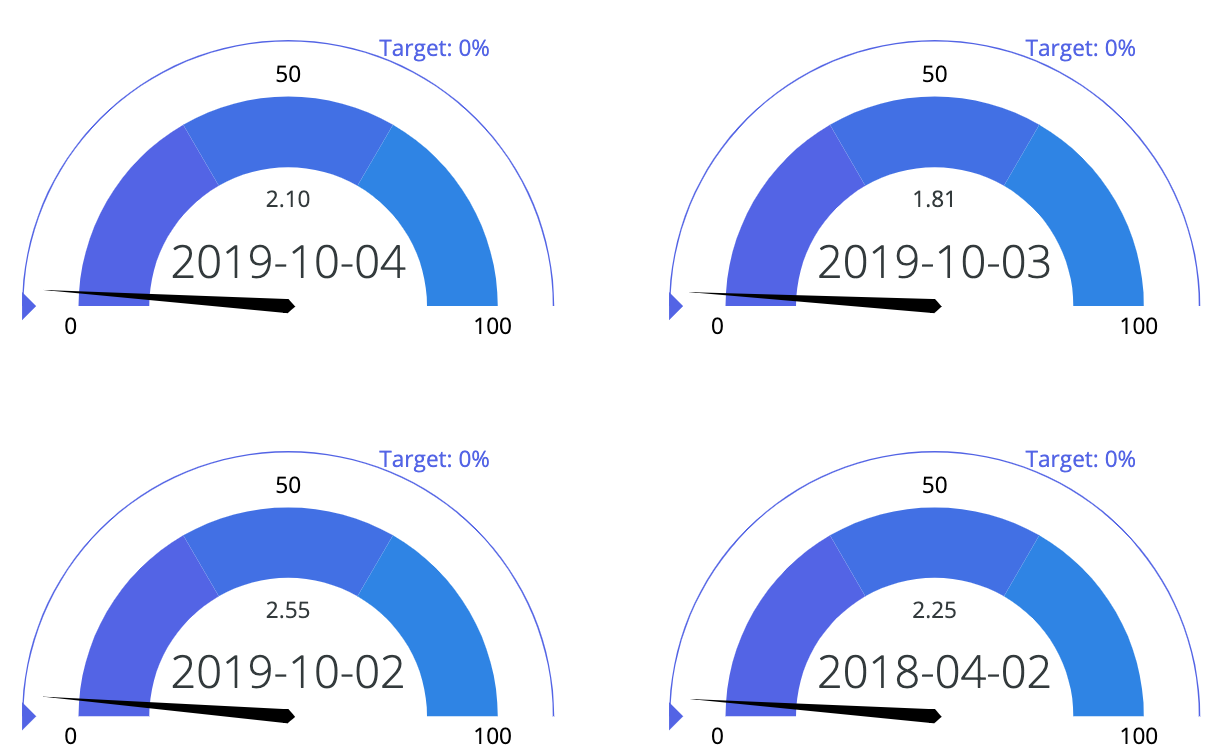
The Gauge Multiple visualization allows viewers to quickly compare the performance of a single metric across multiple categories or attributes. This visualization requires one dimension and one measure. Each row of the dimension field will correspond to an individual Gauge. The target value is flexible, allowing for a separate target for each gauge.
For example, the visualization below displays a metric’s value across four fiscal quarters.
This visualization accepts one dimension and one measure, with the ability to hardcode a target value.