
Multiple Value Visualization
By Google
Use the Multiple Value visualization to display and compare multiple measures across a single tile. This visualization can be arranged horizontally or vertically.
Use the Multiple Value visualization to display and compare multiple measures across a single tile. This visualization can be arranged horizontally or vertically.
Category
Plug-insOverview
Install this plug-in for free by importing the project(s) from the GitHub repository linked at the top of the listing.
This is not an officially supported Google product.
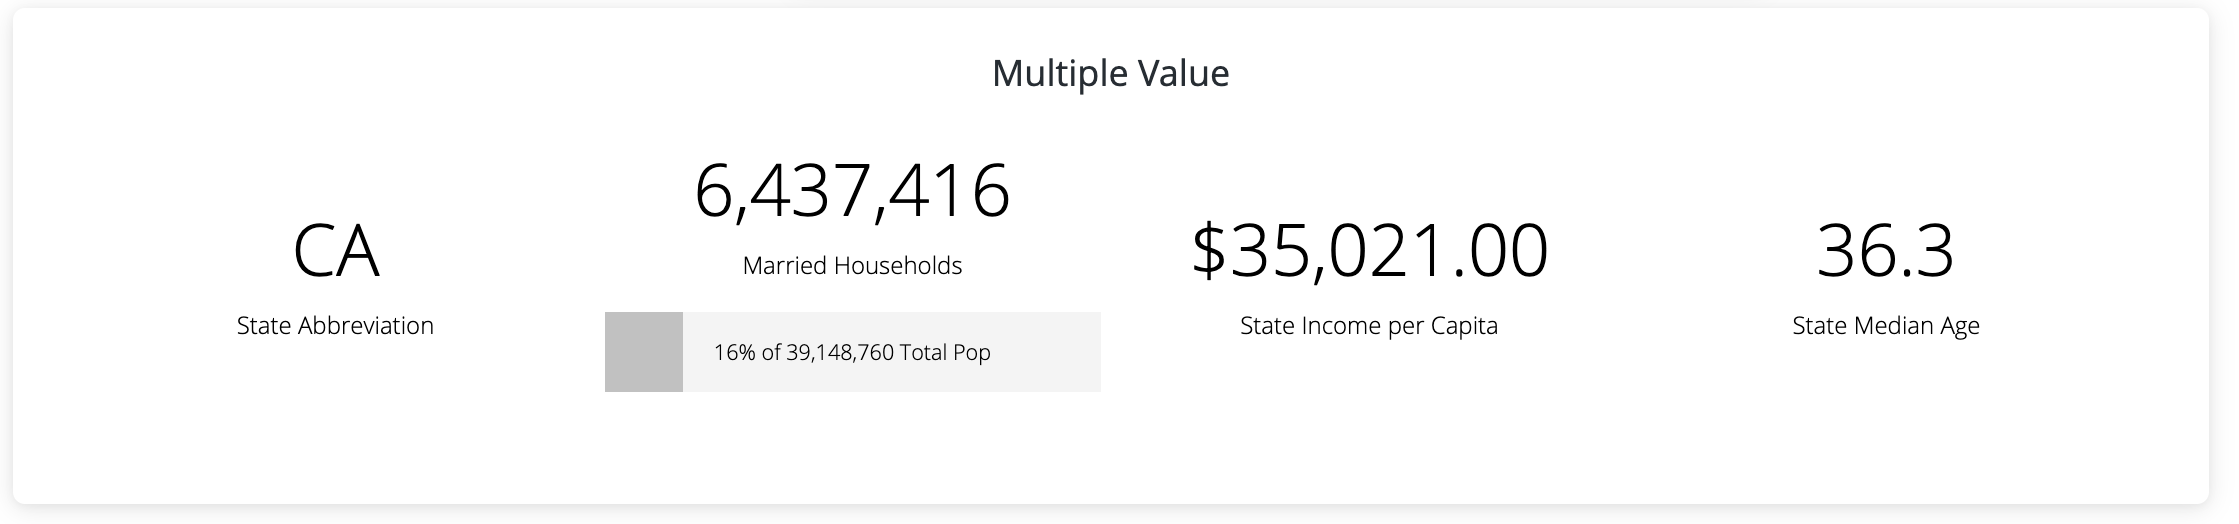
The Multiple Value visualization offers a concise way to display multiple values together in a single tile.It’s an effective layout for grouping similar types of content or related metrics.
The visualization takes a series of measures, and plots them horizontally or vertically, with the ability to toggle comparisons for each value.
The example below depicts four key metrics to an illustrative e-commerce store. An analyst might place this tile along the top or side of their dashboard for quick reference.
This visualization requires one to ten measures including those used for comparisons.