
Packed Bubble Visualization
By Google
Use the Packed Bubble visualization to display data in a cluster of bubbles.
Use the Packed Bubble visualization to display data in a cluster of bubbles.
Category
Plug-insOverview
Install this plug-in for free by importing the project(s) from the GitHub repository linked at the top of the listing.
This is not an officially supported Google product.
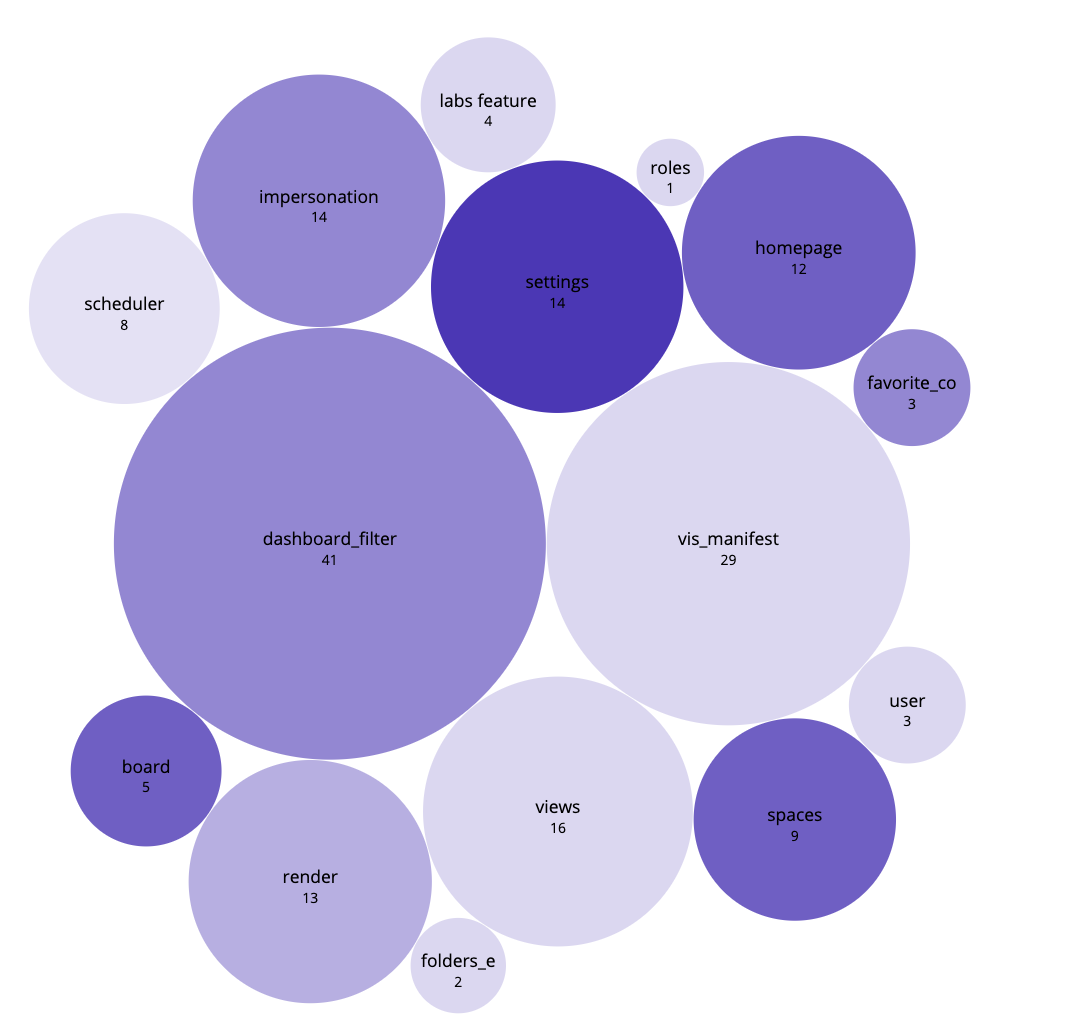
The Packed Bubble visualization displays two numeric values simultaneously. Each bubble is defined by a dimension value, while the color and size of the bubbles are determined by the corresponding numeric measures. Sizes and colors of the bubbles make it easy to visualize outliers between measures and give a general sense of the distribution for the measures.
The example below shows Looker's System Activity components sized by query runtime in minutes and colored by query count. The ‘settings’ component has moderate relative query runtime in minutes but high query counts — indicating short but frequent visits.
This visualization requires one dimension and two measures.