
Radial Gauge Visualization
Category
Plug-insOverview
This is not an officially supported Google product.
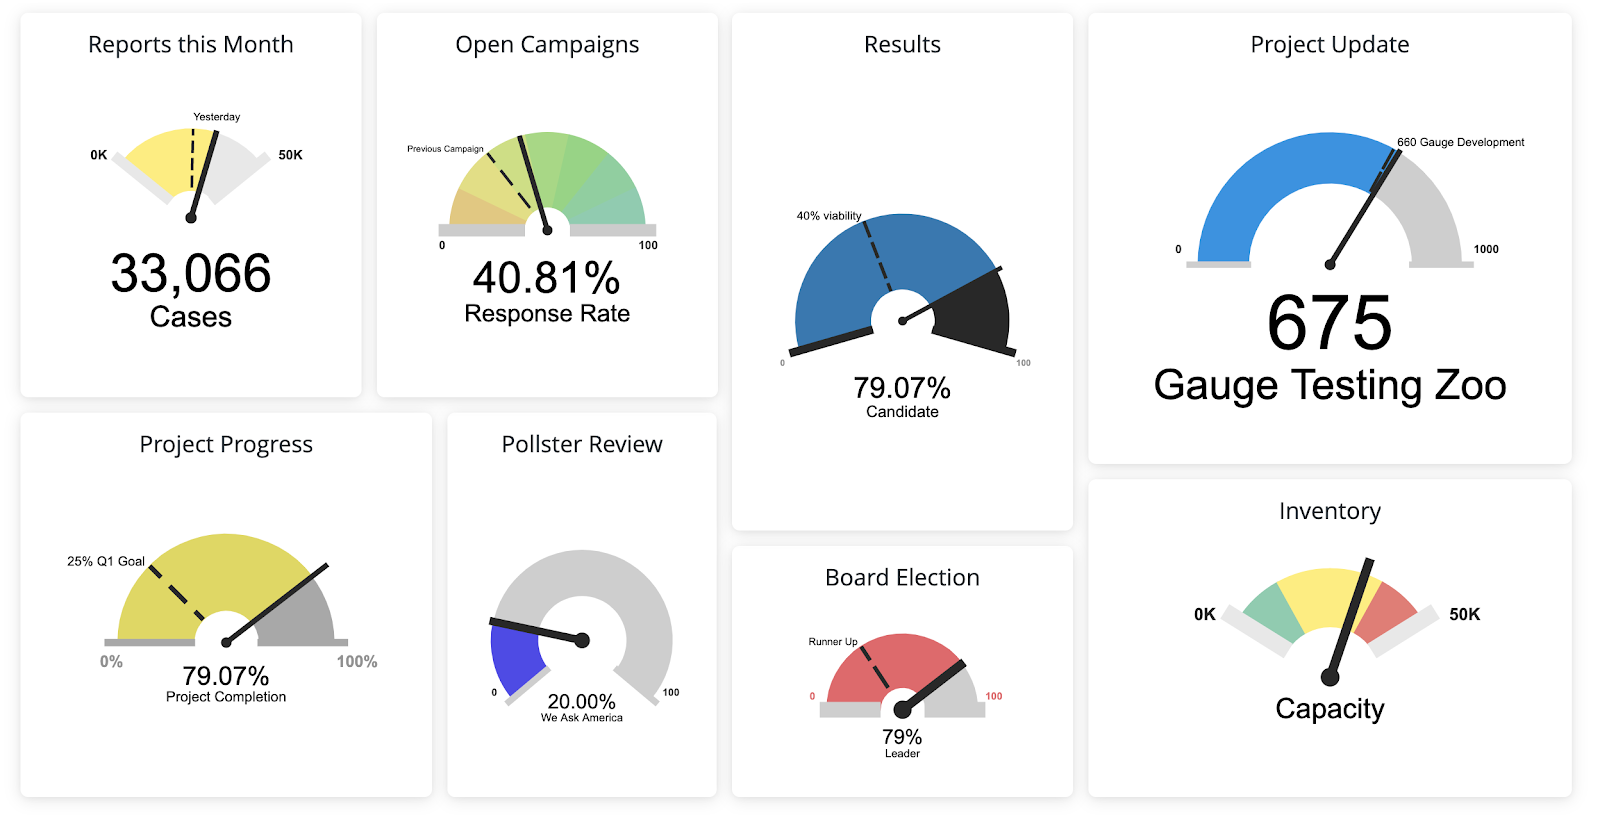
The Gauge visualization displays a single value that measures progress toward a goal. It allows the viewer to assess the performance of a KPI at a quick glance. The circular arc can be styled by progress, progress segment, or segment fill, with the ability to assign a target value or goal through both measures and a hard-coded value. This visualization is also an effective mechanism for displaying rate of change, similar to a speedometer, for ‘live’ data. The example below shows various gauges that have been made with this visualization. The different configuration options for this visualization allow for the most customizable gauge experience in Looker. This visualization accepts up to 1 dimension and up to 2 measures. A target value can be derived from the first or second measure, or hard-coded in the options panel.