
Report Table
By Google
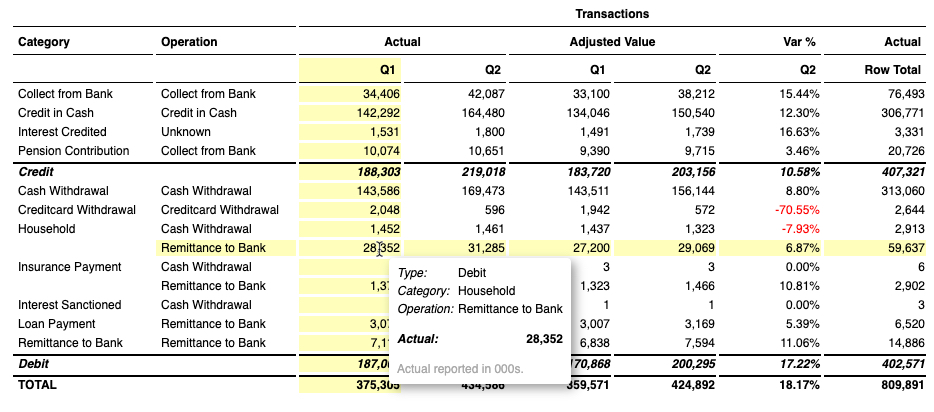
Use the Report Table to create easy to read financial reports.
Use the Report Table to create easy to read financial reports.
Category
Plug-insOverview
Install this plug-in for free by importing the project(s) from the GitHub repository linked at the top of the listing.
This is not an officially supported Google product.
A table dedicated to single-page, enterprise summary reports. Useful for PDF exports, report packs, finance reporting etc. Use this visualization to:
- Conduct quick variance calculations.
- Add subtotals (including column subtotals for tables with two levels of pivot).
- Add header rows to non-pivoted tables.
- Organize measure columns by pivot value, or by measure.
- Implement easy red/black conditional formatting.
- Enable "Subtotal" formatting for highlighting transposed rows of measures.
- Use LookML tags to give default abbreviations to popular fields.
- Reduce large tables to a single dimension value for financial-style reporting.