OTT Analytics by Datazoom
By Google
Datazoom’s video streaming product performance block for OTT provides dashboards to visualize audience growth and engagement, Ad metrics, video QOE, content performance and marketing.
Datazoom’s video streaming product performance block for OTT provides dashboards to visualize audience growth and engagement, Ad metrics, video QOE, content performance and marketing.


Overview
Install this block for free by importing the project(s) from the GitHub repository linked at the top of the listing.
This is not an officially supported Google product.
Use this block to:
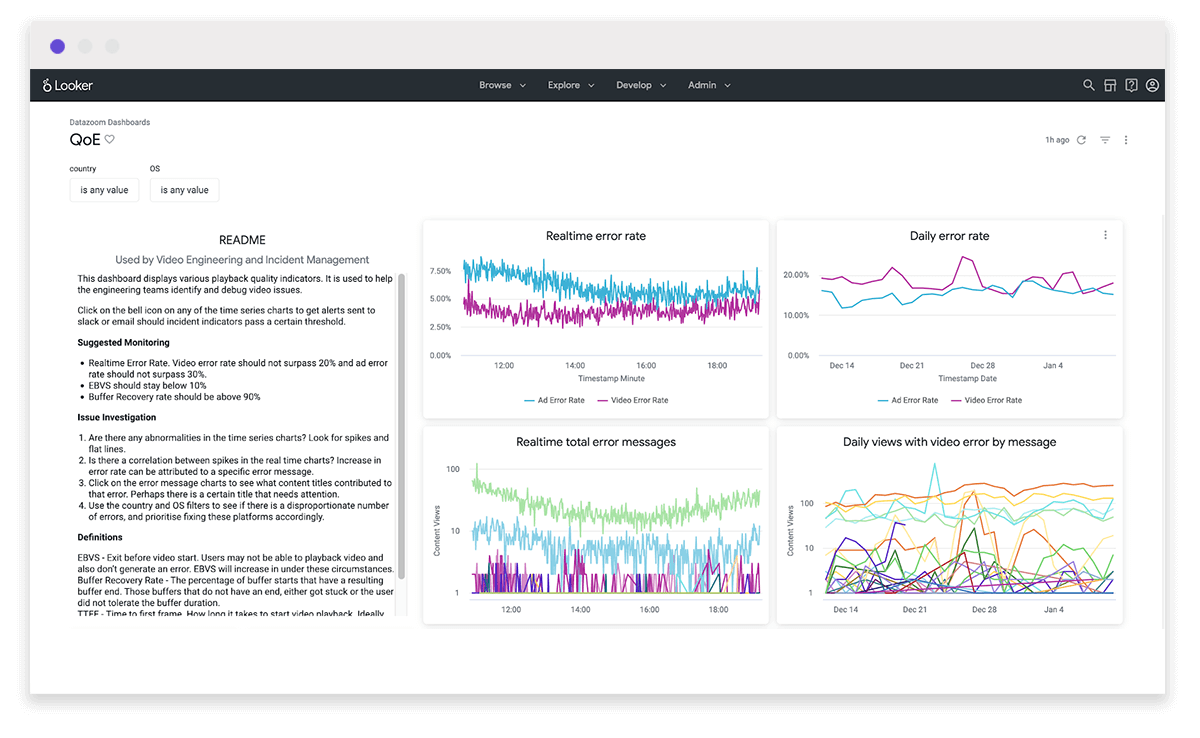
- Monitor and alert on key video performance metrics.
- Easily spot patterns and correlations between video errors, content, location and device, streamlining the debugging process.
- Perform root cause analysis by drilling down into the offending variables.
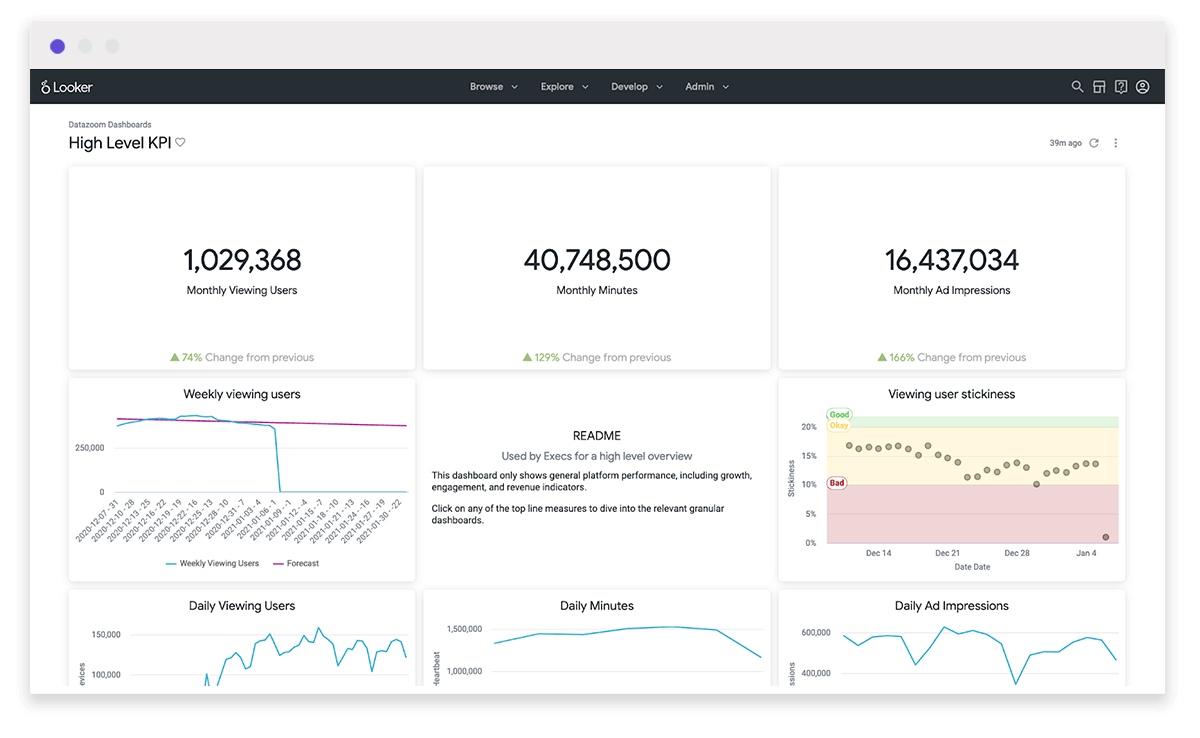
- View how many users are watching content and how much content is being watched.
- Predict user growth and compare user engagement with benchmarks.
- Categorize users by their engagement level, and understand the variables that drive a high level of engagement.
- Find out how many ads are being served and what content they are being served within.
- Determine if ads are successfully viewed or if they are driving users away.
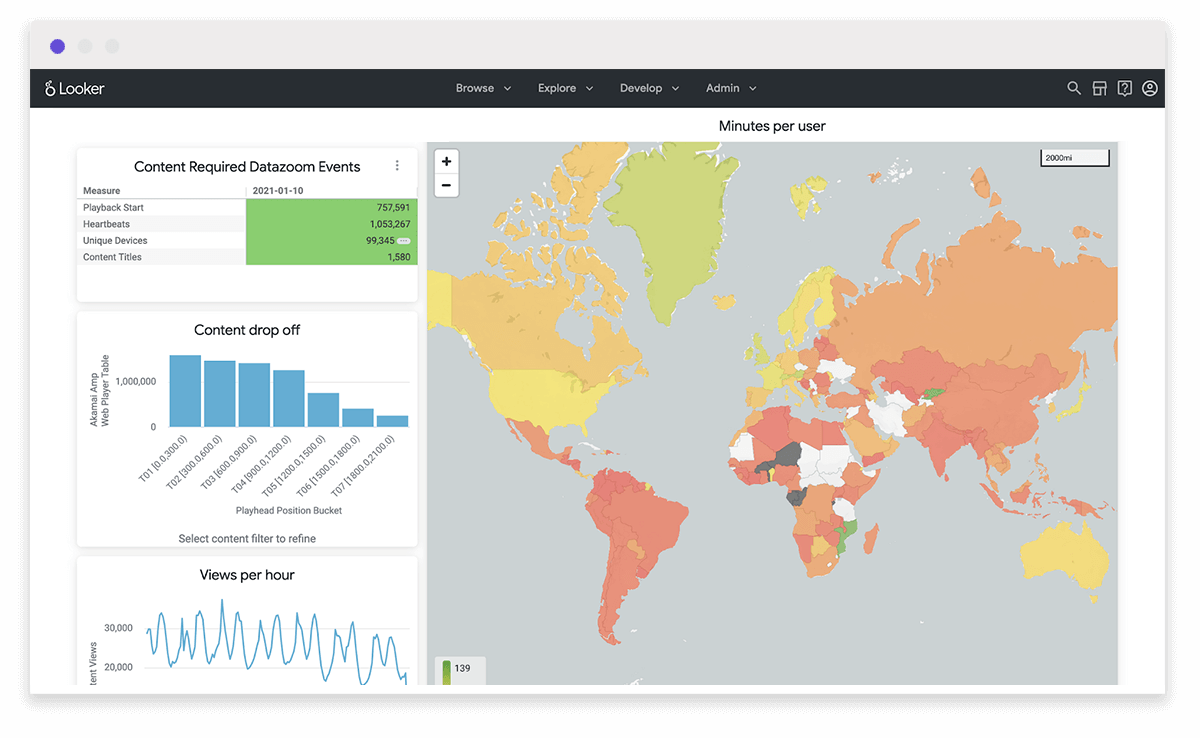
- Understand at what point users abandoned playback. Use this information to create content that keeps users watching.
- See on a map how many minutes on average are being consumed by geographic region. Use this to target curation to the regions most appropriate.
- Time and date the content was most frequently viewed. Use this to time the release of content and marketing.
- Generate content recommendations to increase engagement with existing users.
- Learn which content is underperforming, but has potential to generate more value.
Not a Datazoom customer yet? Click here to learn more about Datazoom and request a demo.