
Operational Intelligence for AlloyDB by Google Cloud
Overview
This is not an officially supported Google product.
AlloyDB for PostgreSQL is a fully managed, enterprise-grade database designed for high-performance transactional and analytical workloads. This Block provides immediate, out-of-the-box visibility into your AlloyDB instance's health by querying its internal system tables, empowering your database administrators with real-time and historical operational insights.
Give your Database Administrators and Data Architects a "Day 0" operational view of their AlloyDB performance without writing a single line of SQL. By pointing directly to AlloyDB's internal pg_stat_statements and system metrics, this Block automatically translates raw infrastructure data into actionable, user-friendly insights.
Use this Block to ensure your database is running optimally, scale your resources proactively, and track long-term resource utilization. A sampling of the analysis in this block includes:
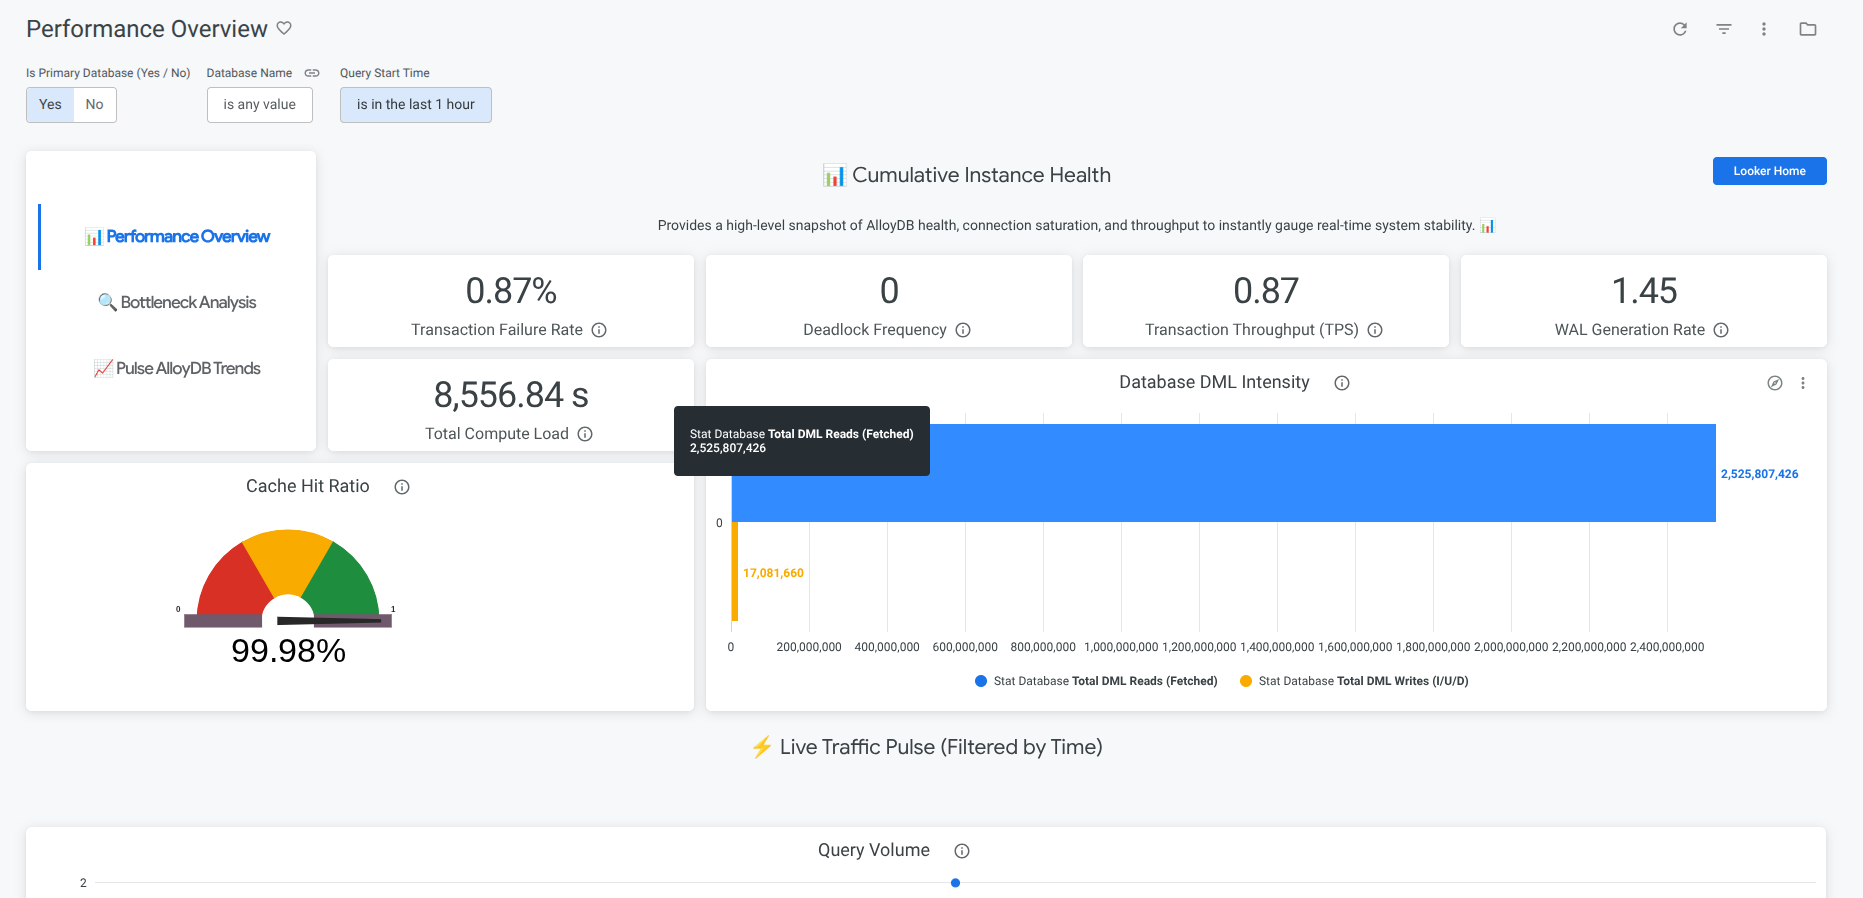
AlloyDB Performance Overview: Get a high-level snapshot of database stability with real-time tracking of Cumulative Instance Health, Connection Saturation percentages, Database Throughput (TPS), and DML Intensity.
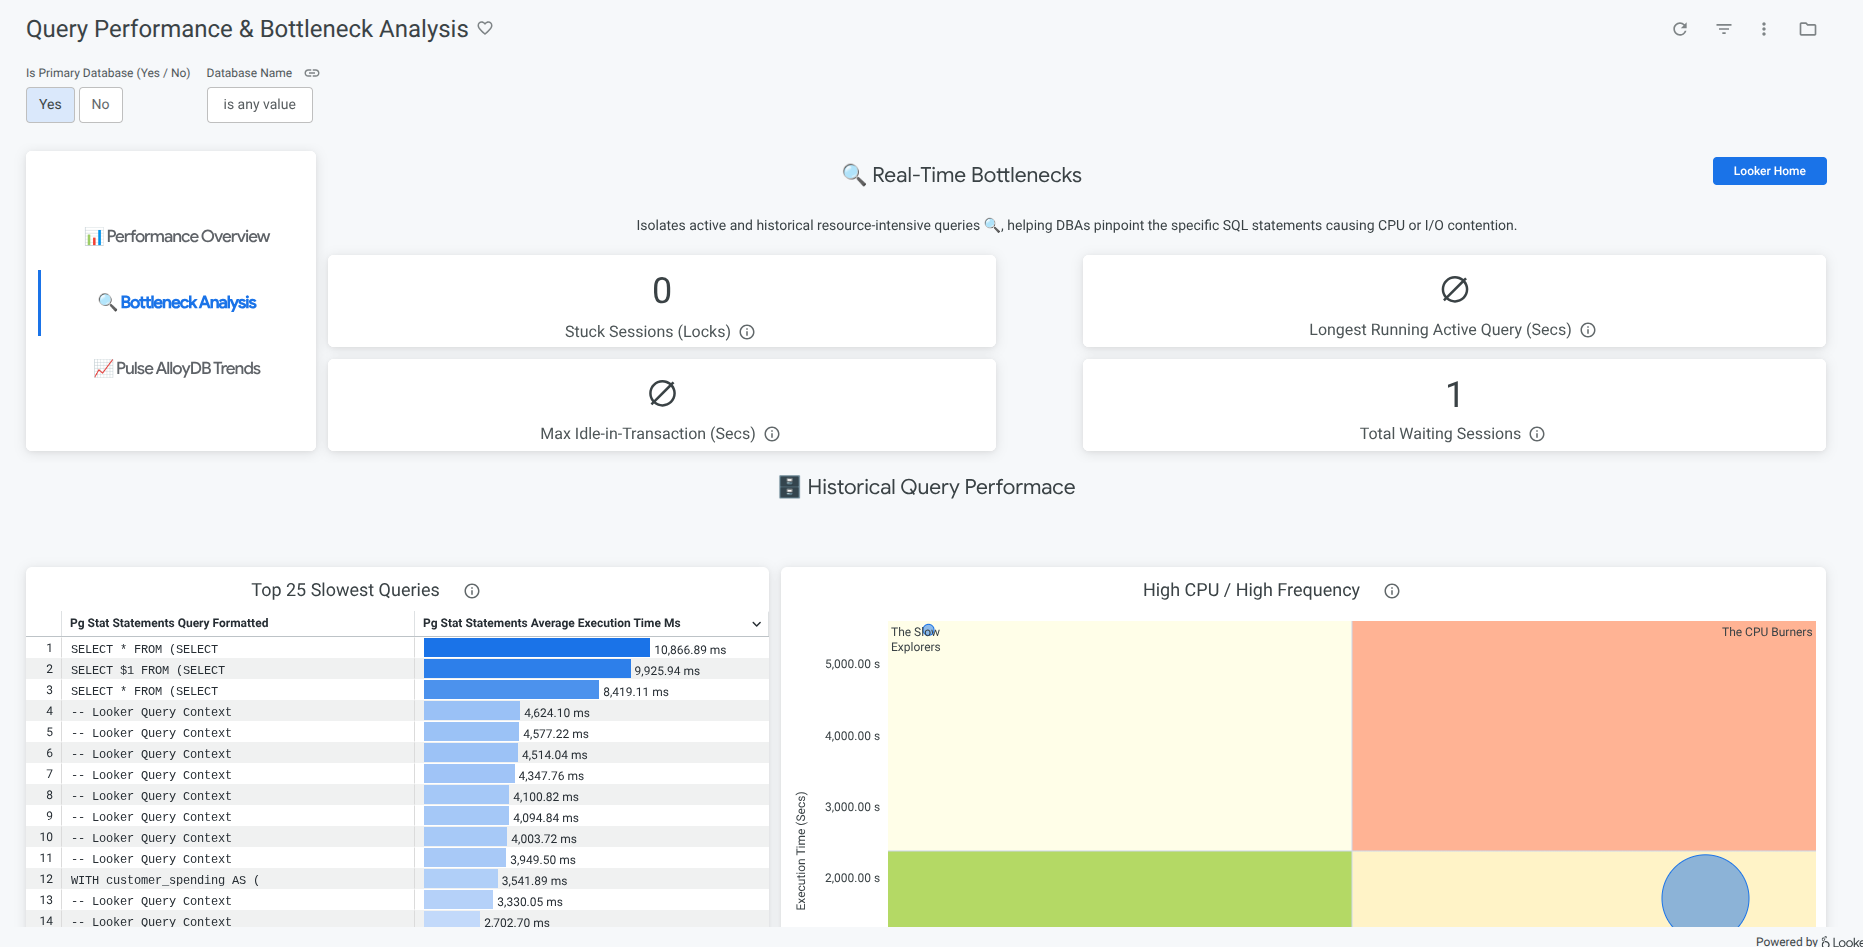
Bottleneck Analysis: Quickly hunt down inefficient queries impacting your database experience. Isolate active bottlenecks like stuck sessions and long-running queries, and view historical query performance to pinpoint the exact raw SQL text driving high resource consumption.
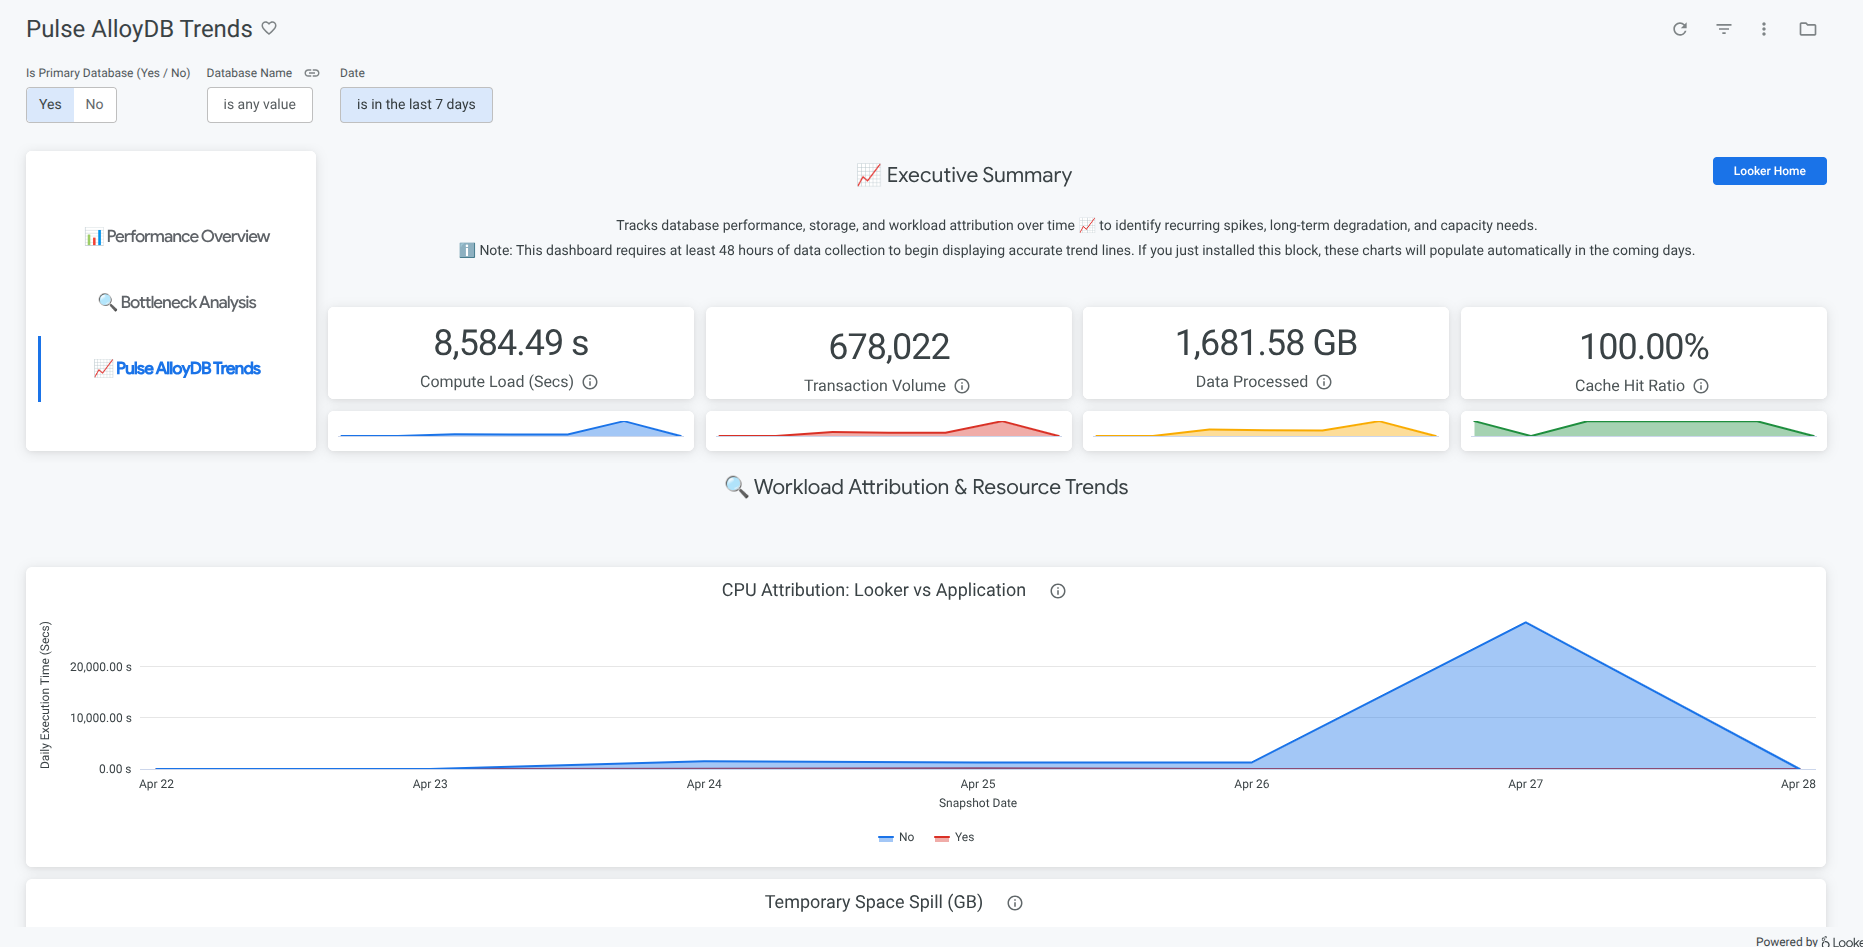
Pulse AlloyDB Trends: Track database performance, storage, and workload attribution over time. Utilizing custom stored procedures to capture time-series data, this dashboard visualizes CPU Attribution, Temporary Space Spills, and recurring performance spikes to help identify long-term capacity needs. (Note: Trend visualizations will populate over 24-48 hours as data accumulates post-installation).